
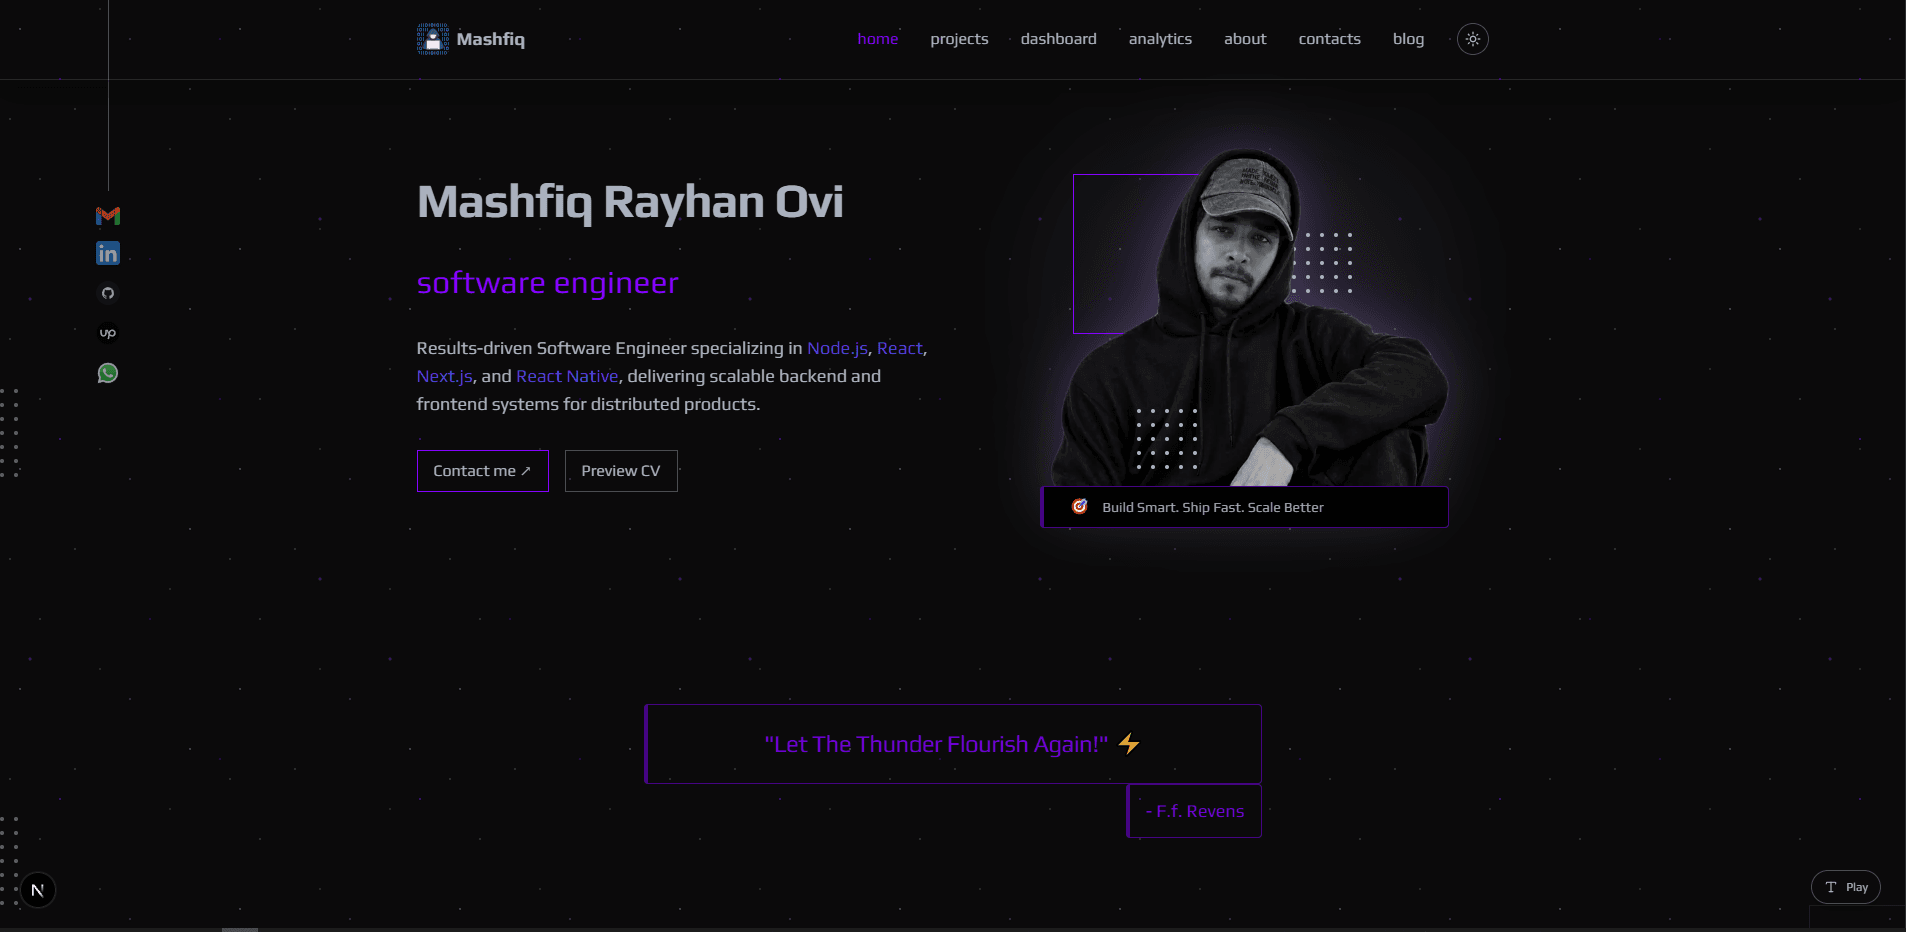
Most portfolio sites are a static page with a project grid and a contact form. Ours is that too, on the surface — but underneath it's a small full-stack product: a serverless Postgres database collecting real visitor telemetry, a WebGL globe rendering that data live, a Google Search Console integration reporting actual ranking data and a blog engine we wrote ourselves instead of reaching for a CMS. We built it this way deliberately. A studio's own portfolio is the one project where we get to make every technical decision unsupervised, so it doubles as a demonstration of how we work when nobody's reviewing the architecture.
The stack and why each piece earns its place
- Next.js 16 (App Router) + React 19 — Server Components for everything that doesn't need interactivity, keeping the client bundle small.
- Tailwind CSS 4 — the new Rust-based engine, which cut noticeable time off cold builds compared to v3.
- @react-three/fiber + drei — for two genuinely interactive 3D scenes, not decoration.
- @neondatabase/serverless — a Postgres connection that works over HTTP, so it's viable from Vercel's edge/serverless functions without connection-pool headaches.
- @next/mdx — content-as-code for the blog, no headless CMS, no external API to go down.
Nothing here is exotic for the sake of it. Three.js shows up exactly twice, both times attached to real data, not a hero-section particle effect.
A visitor analytics pipeline we own end-to-end
The /analytics and /dashboard routes aren't wired to Google Analytics — they read from a visitors table we control in Neon Postgres. Every page view POSTs browser, OS, device, country, city, referrer and a session id to /api/analytics, which lazily creates the table on first write and normalizes text before insert:
await sql`
  INSERT INTO visitors (
    path, browser, os, device, country, city,
    referrer, session_id, ip_address, timestamp
  ) VALUES (
    ${data.path}, ${data.browser}, ${data.os}, ${data.device},
    ${normalizeAnalyticsText(data.country)}, ${normalizeAnalyticsText(data.city)},
    ${data.referrer || null}, ${data.sessionId || null}, ${data.ipAddress || null}, NOW()
  )
`;
The GET side computes sessions, bounce rate (sessions with exactly one page view), average session duration and top pages/countries/browsers/devices — all with plain aggregate SQL, no analytics SaaS in between. Since this runs on serverless functions that don't persist in-memory state reliably, we added a 30-second in-module cache keyed on the query view so a burst of dashboard refreshes doesn't turn into a burst of database round-trips:
const CACHE_TTL = 30_000;
let summaryCache: { data: unknown; ts: number } | null = null;
It's intentionally not billed as bulletproof caching — it's a pragmatic TTL that trades a few seconds of staleness for a meaningfully quieter database, which is the right trade for a dashboard nobody is hammering.
Turning visitor rows into a globe
The dashboard's centerpiece is a WebGL globe that plots real visitor countries as glowing points, sized by traffic share. VisitorGlobe takes the aggregated topCountries data, resolves each country name to lat/lng via a lookup table and hands the points to a dynamically-imported Three.js scene:
const points = topCountries.flatMap((c) => {
  const coords = COUNTRY_COORDINATES[c.name];
  return coords ? [{ name: c.name, lat: coords[0], lng: coords[1], percentage: c.percentage }] : [];
});
The scene is loaded with next/dynamic and ssr: false behind a ViewportCanvas wrapper that defers mounting the Canvas until the section is actually visible — a WebGL context is expensive to spin up and there's no reason to pay for it on a route the visitor hasn't scrolled to.
A project carousel that's really a Fibonacci sphere
The homepage project showcase isn't a horizontal scroller. It arranges every project and side-practice as an HTML card positioned in 3D space using a Fibonacci sphere distribution — the same even-spacing algorithm used for things like geodesic domes — squashed into an ellipsoid so cards stay inside the camera's narrow vertical frustum:
const GOLDEN_ANGLE = Math.PI * (3 - Math.sqrt(5));

function fibonacciSphere(count: number, radiusX: number, radiusY: number, radiusZ: number) {
  return Array.from({ length: count }, (_, i) => {
    const y = count === 1 ? 0 : 1 - (i / (count - 1)) * 2;
    const r = Math.sqrt(Math.max(0, 1 - y * y));
    const theta = GOLDEN_ANGLE * i;
    return new THREE.Vector3(
      Math.cos(theta) * r * radiusX,
      y * radiusY,
      Math.sin(theta) * r * radiusZ,
    );
  });
}
The group rotates continuously and each frame we compute which card has rotated closest to the camera — using the same rotation matrix math, not a DOM measurement — and mark that one "active," expanding it and desaturating the rest. The radii (9 / 3.4 / 7.5) aren't arbitrary; they're tuned wider than a typical reference implementation because this scene combines two data sources (projects and practices, ~22 cards total), well past the card count the naive defaults were comfortable with, so we widened the spread to stop cards from overlapping mid-rotation. That's the kind of tuning that only shows up when you actually put real content volume through a design, rather than testing with three placeholder cards.
Real SEO data, not a vanity badge
The /dashboard also surfaces genuine Google Search Console metrics — clicks, impressions, CTR, average position, top queries — via a hand-rolled service-account JWT flow. There's no googleapis SDK dependency for this; we sign the RS256 assertion directly with Node's crypto module and exchange it for a token:
function signJwt(clientEmail: string, privateKey: string): string {
  const claim = { iss: clientEmail, scope: SCOPE, aud: TOKEN_URL, iat: now, exp: now + 3600 };
  const unsigned = `${base64url(JSON.stringify(header))}.${base64url(JSON.stringify(claim))}`;
  const signature = crypto.createSign("RSA-SHA256").update(unsigned).sign(privateKey);
  return `${unsigned}.${base64url(signature)}`;
}
It's a few dozen lines instead of a dependency, the token is cached in memory until 30 seconds before expiry and it means the "SEO" claims on this site are backed by the same Search Console numbers Google shows us, rendered on our own dashboard instead of screenshotted from an external tool.
A database-backed publishing workflow
Every blog post is stored in the Neon blog_posts table and managed from the private Founder dashboard. Editors can update metadata, Markdown content, cover images and display order without changing application code or redeploying.
Public post pages, listings, RSS, sitemap entries and OpenGraph metadata all read from the same database-backed content layer. Posts are rendered as Markdown with GitHub-flavored tables and code fences; there is no filesystem content source or executable MDX.
Deployment discipline
The app ships as a standalone Next.js output behind a hardened multi-stage Dockerfile — non-root user, health checks, X-Frame-Options, Permissions-Policy with camera/mic/geolocation locked off, poweredByHeader disabled. It's deployable to Railway, Render, Fly.io, or plain docker-compose up -d without touching the app code, because none of the production behavior is tied to a specific host's proprietary build pipeline.
The takeaway
None of this complexity is there to impress — a static portfolio would rank fine and load fast without any of it. It's there because we wanted our own portfolio to be evidence: that we'll reach for the boring dependency (a raw JWT sign instead of an SDK, plain SQL instead of an ORM) when it's genuinely simpler and reach for the unusual one (a hand-tuned Fibonacci sphere, a real-time WebGL globe) when the payoff is a better interaction, not a flashier screenshot. That's the same judgment call we make on every client engagement — just with lower stakes and full creative control.